Understanding Your Monthly Marketing Report
Every month, we send a report that shows changes in leads or sales and the marketing activity connected to them. It explains where each number comes from, how the comparison works, and when a figure is estimated or limited by the measurement setup.
The report combines information from several systems. Google Analytics 4 records measured website activity. Google Search Console reports Google Search clicks. Google Ads reports advertising cost and delivery. Payment, booking, call-tracking, and CRM systems confirm completed business outcomes.
What the Report Shows
The report is organized around four questions:
- Did leads, orders, or revenue change from the same month last year?
- Which marketing channels produced measurable traffic, inquiries, or sales?
- What did paid advertising cost, and how did its recorded results change over time?
- Does this month fit the recent trend, or does it need follow-up?
Detailed diagnostic metrics appear only when they help explain a meaningful change.
Opening the HTML or PDF Report
Your monthly report arrives by email in two formats.
- Desktop or laptop: download the HTML file and double-click it. It opens in your default web browser and does not require a login. You can view the report offline, though its links to websites need an internet connection.
- Phone or tablet: use the PDF for the most consistent reading experience. The HTML report adapts to smaller screens, but detailed tables and charts are usually easier to review in the PDF or on a larger screen.
- Sharing: forward the email or send either attachment as a file.
How to Read Metric Cards and Trends
Each metric card shows the current reporting period, a comparison, and the prior value.
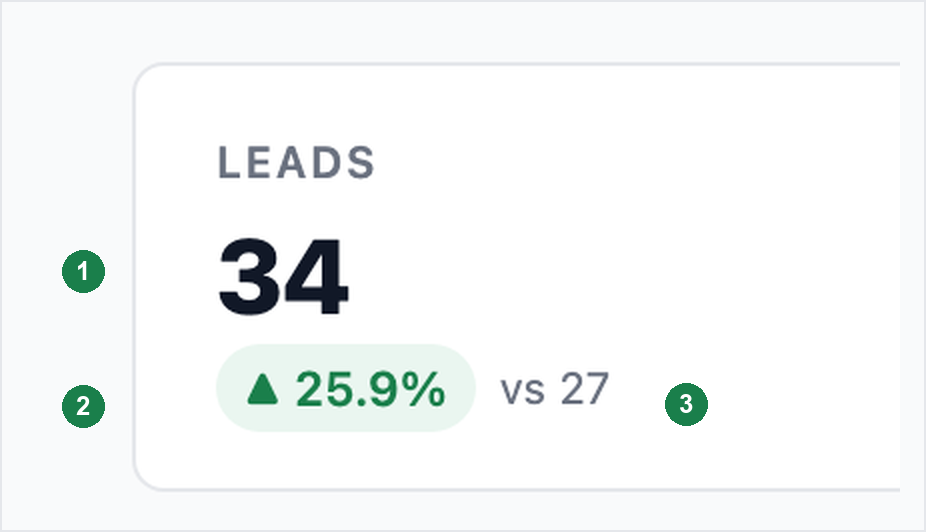
Example metric card showing the current value, comparison, and prior-period figure. Examples on this page use fictional businesses and sample data.
- The large number is the current month.
- The change badge compares it with the period named in the section, usually the same month last year.
- The “vs” figure shows the comparison-period value behind the percentage change.
Green and red indicate the direction that is generally favorable for that metric. For cost metrics such as cost per lead, a lower value is usually favorable. Some cards include a short note when the number needs more context, such as a changed tracking setup, a small sample, or a delayed conversion window.
Service Business Reports
Service-business reports focus on recorded leads: the actions that indicate a prospective customer contacted the business or requested service. Depending on the business, this may include a verified form submission, phone-call lead, appointment request, booking, or consultation request.
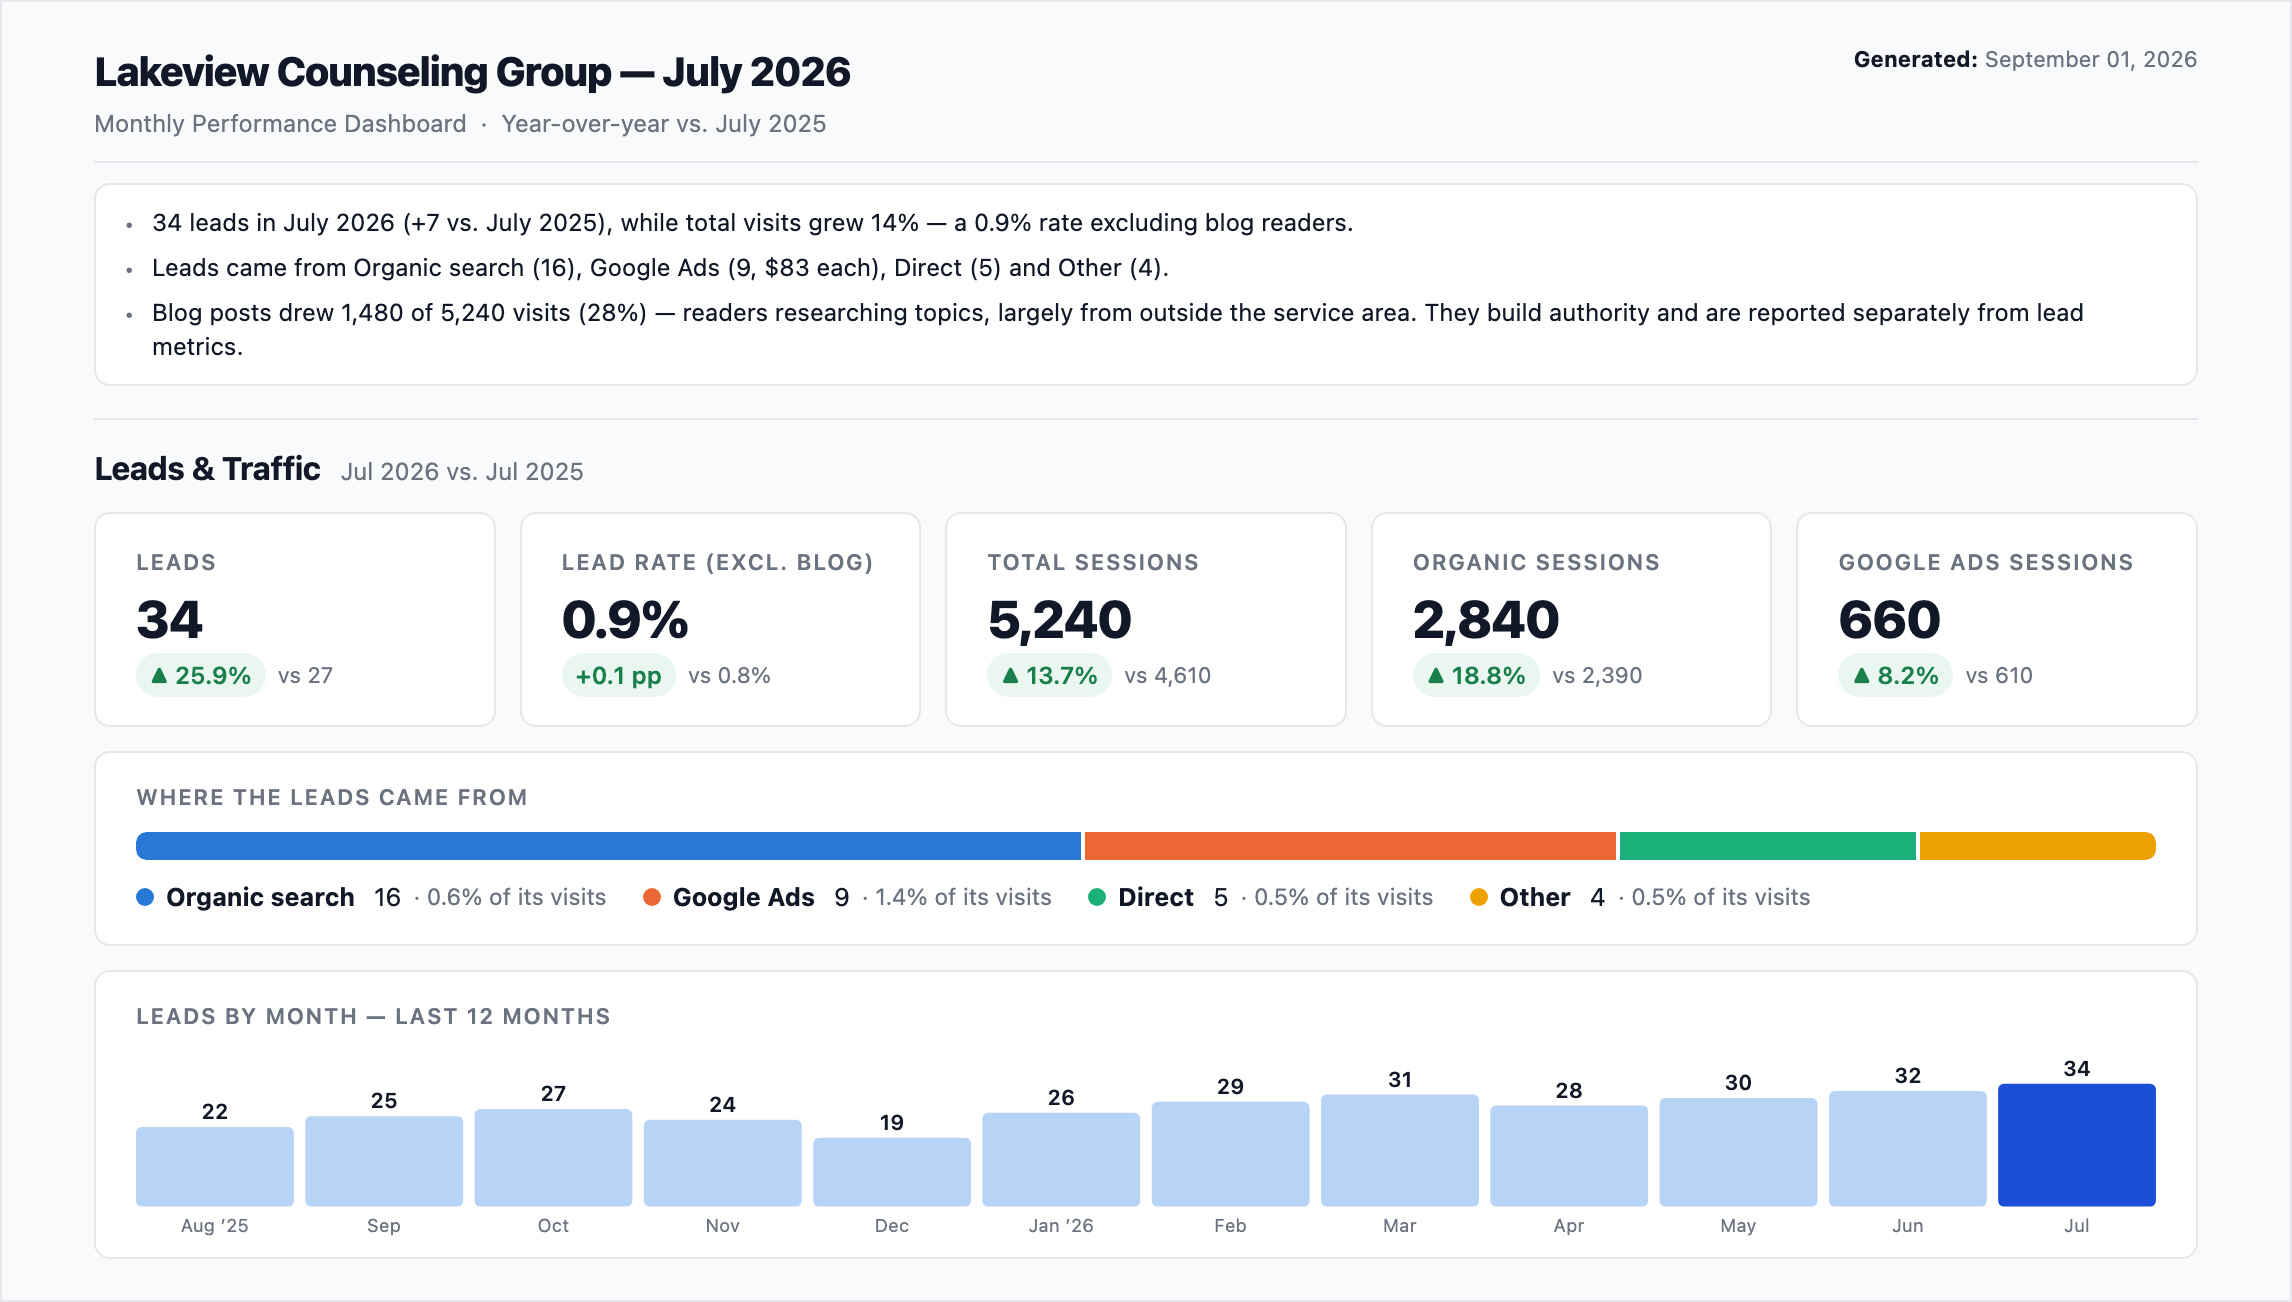
Example service-business report showing leads, lead sources, and the 12-month lead trend. Fictional business and sample data.
| Metric | Definition | Primary source | Why it matters |
|---|---|---|---|
| Leads | Recorded actions included in the agreed lead definition, such as verified form submissions, calls, or booking requests | Google Analytics 4, call tracking, booking system, or CRM | Shows how many prospective customers contacted the business |
| Leads by source | The measured channel associated with a recorded lead | Google Analytics 4 attribution | Helps identify channels that contribute to inquiries |
| Lead rate | Recorded leads divided by relevant measured website visits | Google Analytics 4 and the agreed lead definition | Shows the share of relevant visits that became inquiries |
| Google Ads cost per lead | Google Ads spend divided by recorded Google Ads leads | Google Ads | Shows the average ad cost of each recorded lead |
| Lead trend | Monthly recorded leads across the prior 12 months | The agreed lead-data source | Shows whether the current month fits the recent pattern |
| Google Search clicks | Clicks from unpaid Google Search results to the site | Google Search Console | Shows changes in search traffic to important service pages |
Example: How Lead Rate Is Calculated
A counseling practice received 24 recorded leads in June. Its service, provider, and contact pages received 600 relevant website visits. 24 divided by 600 is 4.0%, so the lead rate was 4.0%.
If the practice also had 2,000 blog visits from people reading general mental-health articles, those visits would not necessarily belong in the lead-rate denominator. Including them would make the rate appear much lower even if the service pages performed the same way.
When Lead Rate Uses Relevant Visits
Lead rate compares recorded leads with the website visits most likely to produce an inquiry. Some businesses publish educational content that attracts a wider research audience than their service area or customer base. When blog traffic would distort the rate, the report calculates lead rate from service, provider, and contact-page visits instead. For most service clients that means the reported rate excludes blog visits, and the label beside the metric states the visit set used.
Google Ads for Service Businesses
The Google Ads section shows ad spend, paid clicks, recorded leads, and cost per lead. Cost per lead is Google Ads spend divided by recorded Google Ads leads. It relates advertising cost to an inquiry, and it reads best over several months when lead counts are low or customers take time to decide.
Example: How Cost Per Lead Works
A law firm spent $1,200 on Google Ads and recorded 12 Google Ads leads. $1,200 divided by 12 is $100, so the recorded cost per lead was $100.
That number becomes useful next to the value of a qualified lead and the account’s recent trend. If the firm typically earns several thousand dollars from a new client, a $100 recorded cost per lead may be acceptable. If the same campaign produces fewer qualified leads over several months, the trend shows that change rather than one month deciding the answer.
Google Ads and Google Analytics 4 may report different lead totals because they use different conversion definitions, attribution settings, and reporting dates. The report uses the agreed lead source for total lead volume and Google Ads for advertising spend, clicks, and paid-media efficiency.
Organic Search for Service Businesses
The report separates branded and non-branded Google Search clicks when that distinction is useful. Branded searches include the business name and generally reflect existing awareness. Non-branded searches use service, location, or problem terms and can indicate discovery by people who do not yet know the business.
Ecommerce Reports
Ecommerce reports lead with sales outcomes: revenue, orders, average order value, and the revenue trend when reliable order data is available. The report then shows organic-search demand, advertising delivery, and channel patterns that help explain those outcomes.
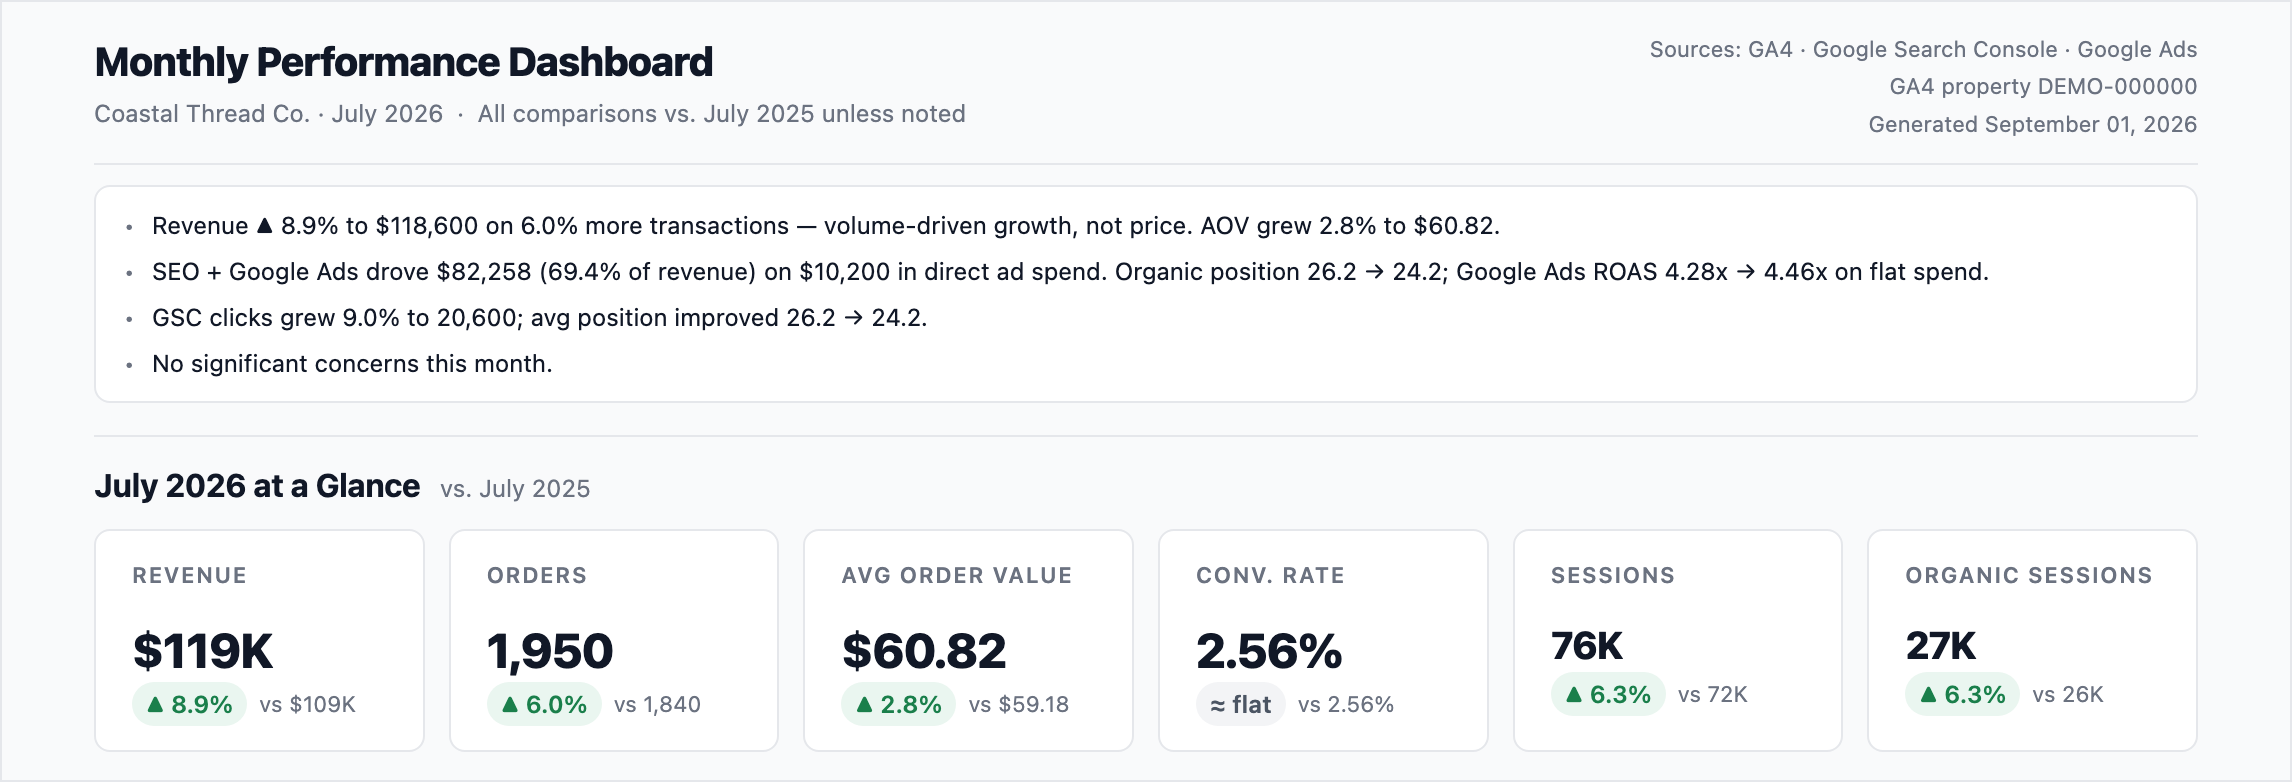
Example ecommerce report summary with revenue, orders, and average order value. Fictional store and sample data.
| Metric | Definition | Primary source | Why it matters |
|---|---|---|---|
| Settled revenue | Payments collected during the reporting period, using the financial definition stated in the report | Payment processor, ecommerce platform, or order system | The sales figure used for monthly and year-over-year comparisons |
| Orders | Completed purchases counted from the order or payment system | Ecommerce platform, order system, or payment records | Shows whether sales changed because of order volume |
| Average order value | Settled revenue divided by completed orders | Order system or payment records | Shows whether customers spent more or less per completed purchase |
| Recorded revenue | Purchase revenue captured by Google Analytics 4 | Google Analytics 4 | Supports channel and behavior analysis. It may differ from settled revenue |
| Estimated revenue by channel | Settled revenue split across observed acquisition channels | Google Analytics 4 plus payment or order data, when estimation is needed | Compares relative channel contribution. Not an accounting record |
| Recorded Google Ads purchase value | Purchase value directly observed by the Google Ads conversion setup | Google Ads | The observed minimum paid-purchase value when tracking coverage is limited |
| Recorded ROAS | Recorded Google Ads purchase value divided by Google Ads spend | Google Ads | Shows recorded return relative to ad cost. May understate the return associated with paid traffic when tracking is incomplete |
| Google Search clicks | Clicks from unpaid Google Search results | Google Search Console | The main organic-search traffic measure in the report |
How Revenue, Orders, and Average Order Value Work Together
Revenue can change for two basic reasons: the business received more or fewer orders, or customers spent more or less on each order. Average order value, often shortened to AOV, is revenue divided by completed orders and separates the two.
An online store collected $50,000 in June from 1,000 completed orders, an AOV of $50. In July it collected $55,000 from 1,000 orders. Orders did not change, but AOV rose to $55, so the growth came from larger average purchases. If July had instead reached $55,000 from 1,100 orders with AOV near $50, the growth would have come from more completed purchases.
AOV is useful when it is based on complete order data. If reliable order counts are not available, the report does not present AOV as a store-wide result.
Revenue by Marketing Channel
The channel table shows how measured visits and recorded purchases are distributed across sources such as Organic Search, Google Ads, Email, Organic Social, Referral, and Direct.
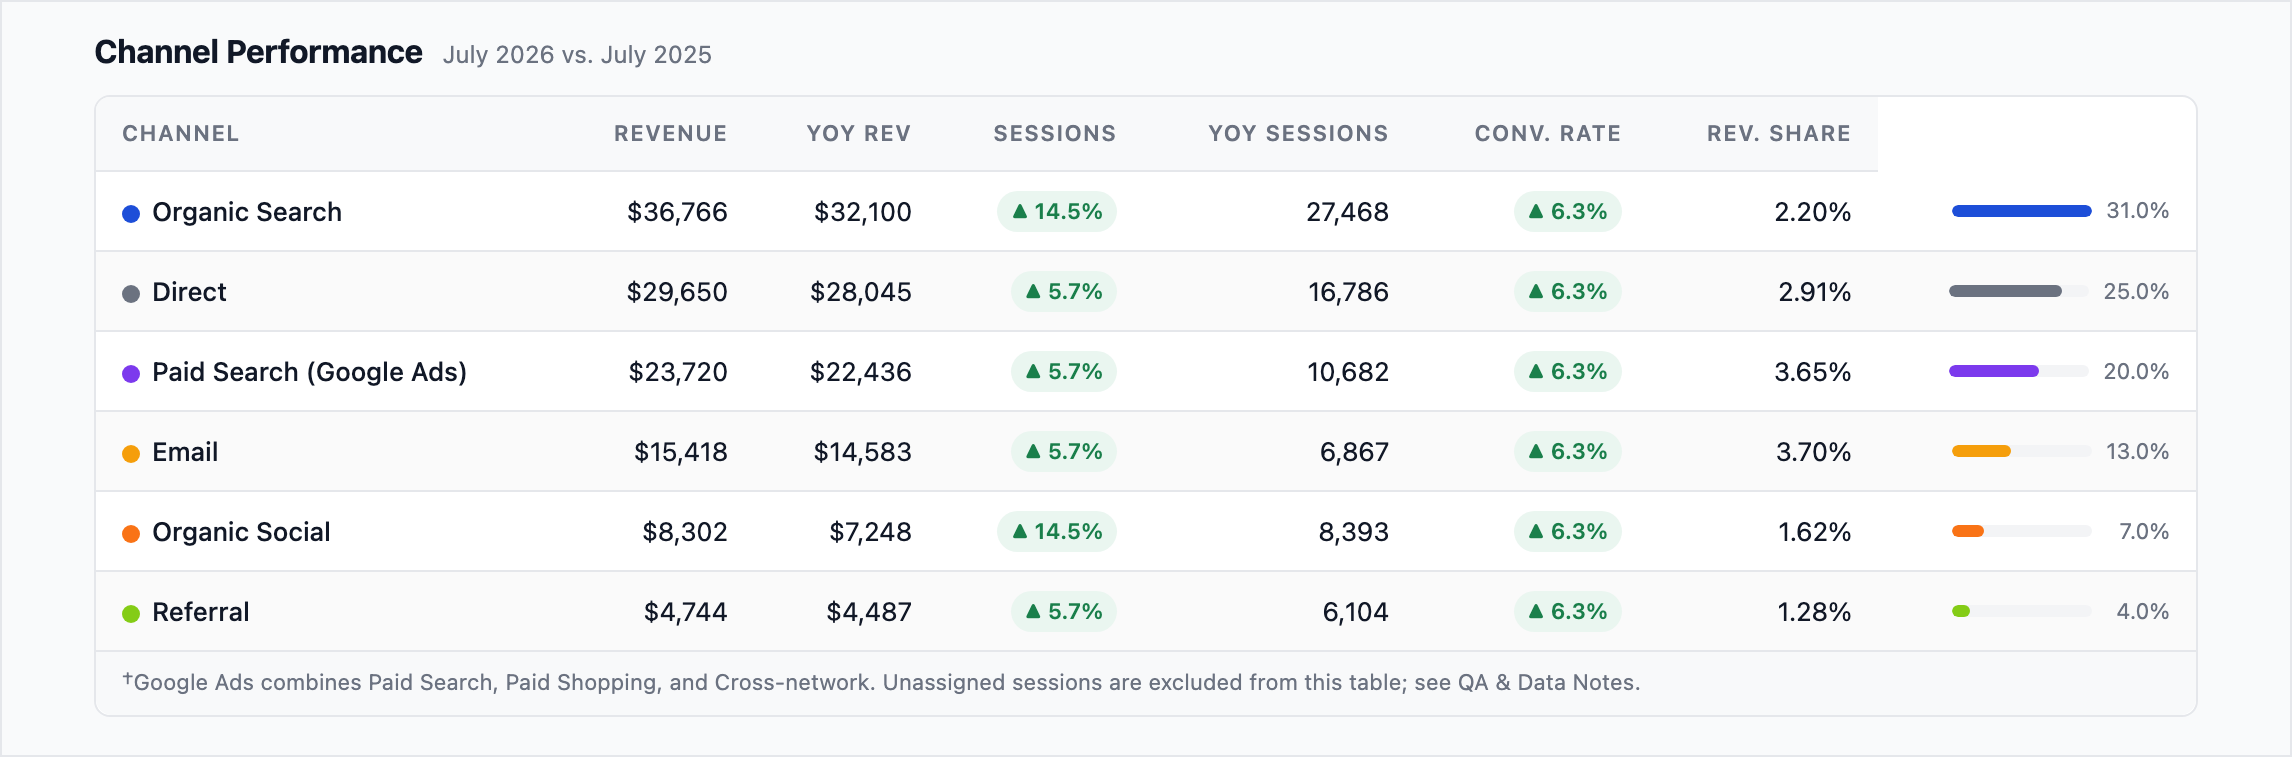
Example channel table showing revenue, sessions, and revenue share by channel. Fictional store and sample data.
Channel figures are attribution, not accounting: they show the measured path to each recorded sale, not every influence on the decision. Unassigned source data is shown separately because it is a measurement limitation, not a marketing channel.
When Ecommerce Metrics Are Estimated
Most ecommerce reports use directly measured platform and payment data. Estimation is used only when a material tracking limitation, such as strict cookie-consent settings, prevents analytics from observing all purchases or all traffic.
In that situation, payment or order records remain the source for revenue. Google Analytics 4 can still show the channel mix among measured purchases, and the report may use that mix to estimate relative channel contribution. The data-quality label and methodology appear beside the affected figures.
Example: Estimated Channel Contribution
An online store collected $100,000 in settled revenue during the month. Google Analytics recorded $35,000 of that revenue from visitors it was able to measure. Within that measured sample, Organic Search represented 40% of recorded revenue, Google Ads 20%, Email 10%, and other sources 30%.
The report may apply those proportions to the $100,000 settled total:
| Channel | Share of measured revenue | Estimated contribution |
|---|---|---|
| Organic Search | 40% | About $40,000 |
| Google Ads | 20% | About $20,000 |
| 10% | About $10,000 | |
| Other sources | 30% | About $30,000 |
These are estimates. They show the observed channel mix applied to the confirmed sales total. They do not prove that a specific channel caused a specific dollar amount of revenue, which is why estimated dollar values are rounded.
SaaS and Subscription Reports
A SaaS or subscription report leads with signups rather than leads or orders. The shape is the same as a service-business report, with different words in the same places: a visitor arrives, takes a first step that identifies them, and then moves through the steps that turn a signup into an active account.
Email signups counts people who gave you an email address and started an account. It is the first committed action, and it is the number most SaaS reports lead with. Signups from ads is the subset that arrived from paid campaigns, which is what makes cost comparisons possible.
Signup rate is signups divided by sessions, the same arithmetic as lead rate on a service report and purchase rate on an ecommerce report. If 4,000 sessions produce 120 signups, the signup rate is 3%.
Cost per signup is ad spend divided by signups from ads. If a campaign spends $6,000 and produces 150 signups, cost per signup is $40. The caution that applies to cost per lead applies here too: a lower cost per signup is only better if those signups go on to become accounts, which is what the funnel below is for.
Signups Are Not the Same as Customers
A signup is the start of a process, not the end of one. Between an email address and a paying account there are usually several steps: confirming the address, completing a profile, entering billing details, finishing onboarding.
That gap is why a SaaS report has to show the steps rather than only the total. Two months with the same number of signups can produce very different numbers of active accounts, and the total alone will not tell you which one you had.
How to Read a Conversion Funnel
A funnel shows how many people reached each step of a process, in order, from the first step to the last. Each step is a subset of the one above it, so the numbers only ever go down.
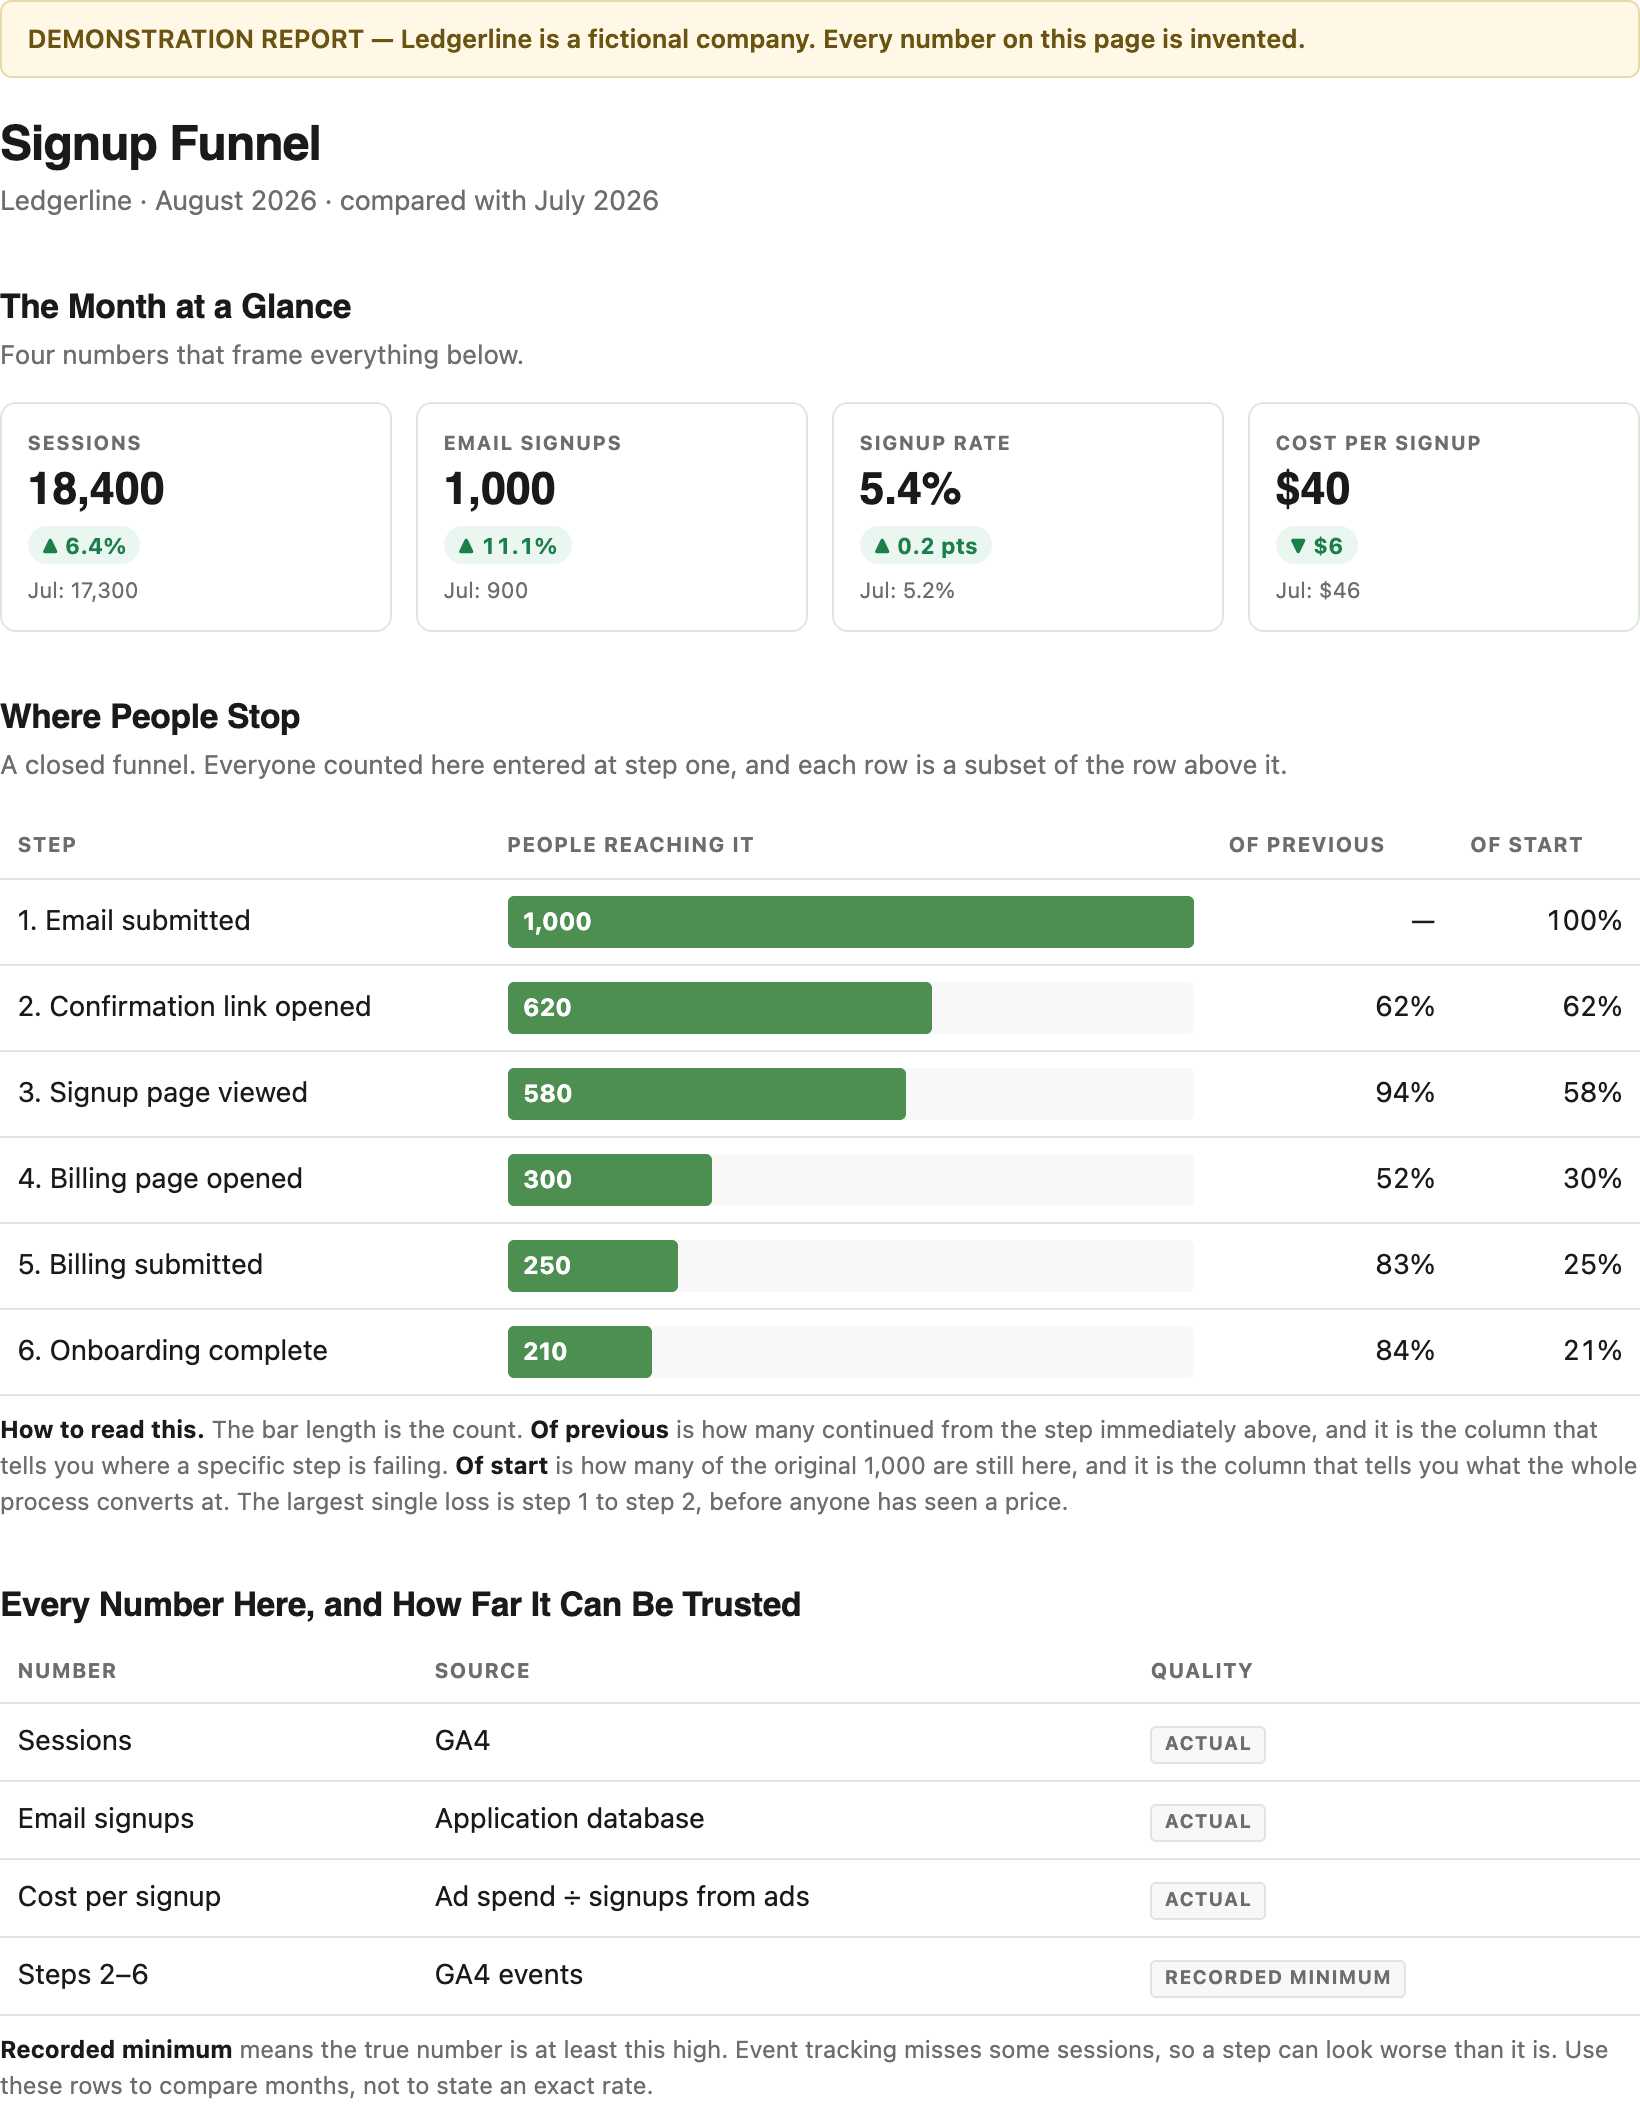
Example signup funnel from a monthly report. Ledgerline is a fictional company and every number is invented.
Read the Drops, Not the Totals
The counts at each step are the least interesting part. What matters is how much you lose between steps, because that is where something is going wrong.
In the example above, 1,000 people submitted an email and 620 opened the confirmation link. That is a 38% drop at the very first step, and it happens before anyone has seen a price or a feature. A drop that large that early usually points at something mechanical, such as email deliverability, rather than at anything about the product.
The drop from 580 to 300 at the billing page looks similar in percentage terms, but it means something different. That is the step where cost becomes real, so some loss is expected and normal.
The Biggest Drop Is Not Always the Best Opportunity
It is tempting to attack the largest percentage drop first. Two things complicate that.
A step near the top of the funnel affects more people. Recovering ten percent of a drop that affects 1,000 people is worth more than recovering ten percent of one that affects 250.
And some drops are healthy. A funnel step that filters out people who were never going to be a good fit is doing useful work, and pushing more of them through creates support load rather than revenue.
Two Rates, and They Answer Different Questions
Step-to-step rate is one step divided by the step immediately above it. Billing submitted divided by billing page opened, 250 of 300, is 83%. That tells you how well one specific step performs.
Overall rate is the last step divided by the first. 210 of 1,000 is 21%. That tells you what the whole process converts at.
A single step can improve while the overall rate stays flat, which is normal and not a contradiction. It usually means the gain was offset elsewhere.
When a Funnel Cannot Be Trusted
A funnel is only as good as the events behind it, and three problems are common.
The steps are not really sequential. If someone can reach step four without passing through step three, the drop between them is not a real loss.
A step is not tracked. An untracked step shows as a total collapse, which reads as a catastrophic problem rather than as missing measurement.
The funnel is open rather than closed. A closed funnel counts only people who entered at step one and follows that same group down. An open funnel counts everyone who reached each step from any starting point, and its drops cannot be compared directly. Reports should say which kind they show.
This is why the report labels how each number was measured. A funnel built on partial event tracking can still be useful for spotting a large change month over month, but the individual percentages should not be treated as precise.
Comparisons and Data-Quality Labels
How Comparisons and Trends Work
The report uses the comparison that best fits the metric.
| Comparison | Used for | Why it is useful |
|---|---|---|
| Year over year | Leads, revenue, and Google Search clicks | Compares the same calendar month and reduces the effect of normal seasonality |
| Month over month | Advertising spend, campaign activity, and recent changes | Shows recent movement, but can be affected by promotions and seasonality |
| 12-month or 13-month trend | Leads, revenue, organic clicks, paid clicks, and CPC | Shows whether the current month fits a longer pattern |
| Trailing average | Volatile cost-per-lead, cost-per-conversion, or ROAS measures | Smooths short-term variation while leaving the actual monthly value visible |
Google Ads can attribute a conversion after the ad click that led to it, so recent cost-per-conversion and return figures may change as later conversions are recorded. The Google Ads section states the timing and comparison basis it uses.
Data-Quality Labels
The report adds a label when a metric needs context about measurement coverage, estimation, or comparability. Metrics that are complete for the stated source appear without one.
| Label | Meaning | Example |
|---|---|---|
| Actual | Complete for the stated source and reporting purpose | Settled revenue, Google Ads spend, Google Search clicks |
| Estimated | Calculated from observed or partial data to show a pattern | Estimated revenue by channel |
| Recorded minimum | The amount the tracking system directly observed. Additional activity may not be recorded | Google Ads purchase value with incomplete tracking coverage |
| Observed | Activity recorded by the reporting platform | Sessions, observed purchase rate |
| Not comparable | A changed measurement method or population makes an earlier comparison misleading | A session trend across a material tracking change |
| Not attributable | Activity was recorded, but source data was insufficient for reliable channel assignment | Unassigned source data |
| Insufficient volume | Too little data exists for a reliable rate or trend | A low-volume referral source |
These labels tell you whether a figure is complete, estimated, or limited by the measurement setup.
Data Sources and Common Terms
| Source | What it provides | How it is used |
|---|---|---|
| Google Analytics 4 | Measured visits, website events, lead actions, purchases, and channel patterns | Measured website behavior and cross-channel analysis. Coverage can be affected by consent choices, browser restrictions, and ad blockers. See how to grant access. |
| Google Search Console | Google Search clicks, queries, landing pages, and visibility diagnostics | The primary source for Google organic-search clicks and page and query analysis. See our Search Console guide for business owners. |
| Google Ads | Spend, clicks, cost per click, recorded conversions, and campaign delivery | The primary source for Google Ads cost and delivery. Conversion data depends on the account’s measurement setup. |
| Google Merchant Center | Product eligibility, feed issues, and Shopping diagnostics | Included when Shopping or Performance Max activity makes feed health material |
| Payment processor or order system | Settled revenue, orders, refunds, and average order value | The financial source of record for ecommerce outcomes |
| Email platform | Sends, clicks, automations, and platform-attributed revenue | Email-specific performance. Platform attribution is never added to Google Analytics channel revenue |
| Paid-social platform | Spend, reach, clicks, and platform-attributed actions | Used when paid social is active. Platform results may differ from Google Analytics attribution |
| Call tracking, booking, or CRM system | Calls, bookings, qualified leads, and customer status | Confirms service-business outcomes and lead quality |
When two sources disagree, the report uses the source that best matches the question, and the affected metric is labeled accordingly.
Conversion Rate, Lead Rate, and Purchase Rate
A conversion rate is the percentage of measured visits that completed a defined action: recorded conversions divided by measured visits, times 100. A lead rate is a conversion rate where the defined action is a lead, such as a contact form, call, or booking request. A purchase rate is a conversion rate where the defined action is a completed purchase.
The calculation is only useful when the numerator and denominator cover the same measured population. If a tracking change affects one more than the other, the rate is labeled observed or not comparable, or it is left out.
Google Ads Terms
| Term | Definition | Why it matters |
|---|---|---|
| Ad spend | Amount billed by Google Ads during the reporting period | The advertising investment |
| Clicks | Visits generated by Google Ads | Shows paid traffic volume |
| Cost per click | Ad spend divided by clicks | Shows the average cost of a paid visit |
| Conversion | An advertiser-defined action, such as a lead, purchase, call, or booking | The conversion definition determines what the platform is optimizing and reporting |
| Cost per conversion | Ad spend divided by recorded conversions | Shows the average advertising cost for the defined action |
| Cost per lead | Ad spend divided by recorded leads | The service-business version of cost per conversion |
| Conversion value | Value assigned to recorded conversions | Lets Google Ads assess value-based performance |
| Recorded ROAS | Recorded conversion value divided by ad spend | Shows recorded return relative to advertising cost |
| Search campaign | Ads that appear primarily in Google Search results | Reaches people searching for related terms |
| Performance Max and Shopping | Campaign types that use product data and can appear across Google surfaces | Important for ecommerce feed health and product visibility |
To learn more about the ad formats behind these metrics, see how Google Search ads work and how Google Shopping ads work.
Google Analytics 4 Terms
| Term | Definition | Why it matters |
|---|---|---|
| Session | A recorded visit to the website | Useful for traffic analysis, not a business result by itself |
| Key event | An event marked as important for measurement, such as a lead submission or purchase | Defines the actions used in reports and attribution analysis |
| Attribution | The method used to assign credit for a conversion across prior interactions | Explains why a conversion can appear under different channels in different platforms |
| Default channel group | Google Analytics’ rule-based classification of traffic sources | Determines whether traffic appears as Organic Search, Email, Paid Social, Direct, or another group. Depends on working tags and consistent campaign URLs |
| Direct | A visit without a clear referring source | May include typed URLs, bookmarks, offline links, untagged campaigns, or privacy-limited traffic |
| Unassigned | Measured activity that does not fit a channel-group rule | A source-data limitation, not a marketing channel |
| Observed purchase rate | Recorded purchases divided by measured sessions | Compares sufficiently large measured channel samples. Not always a store-wide rate |
Google Analytics 4 explains how measured visitors arrived and what they did. It does not replace payment records, a booking system, call tracking, or a CRM as the record of completed business outcomes.
Google Search Console Terms
| Term | Definition | Why it matters |
|---|---|---|
| Click | A click from a Google Search result to the site | The main organic-search traffic outcome |
| Query | A Google Search phrase associated with an impression or click | Identifies topics and intent producing search demand |
| Page | The URL Google associates with the search result | Shows which service, category, product, or article pages receive search traffic |
| Branded query | A query containing the business name or a close variation | Generally reflects existing awareness |
| Non-branded query | A query that does not include the business name | Helps identify discovery through service, product, or problem searches |
| Impression | A recorded search-result appearance | A visibility diagnostic, not a visit or business outcome |
| Click-through rate | Clicks divided by impressions | Useful for diagnosing a page or query group |
| Average position | Aggregate position across reported searches | Useful for diagnostics, not a literal rank for one keyword |
Why Platform Numbers Differ
Google Analytics 4, Google Search Console, and Google Ads measure different parts of the customer journey.
Example: One Customer Journey, Several Valid Records
A shopper clicks a Google Ad on Monday, returns through an unpaid Google Search result on Thursday, and makes a purchase on Friday.
- Google Ads records the paid click and may credit the purchase to that ad under its conversion settings.
- Google Search Console records the unpaid Google Search click on Thursday.
- Google Analytics 4 records the website sessions it was able to measure and assigns channel credit using its attribution settings.
- The payment or order system records the completed purchase and revenue.
The systems can show different totals because they measure different interactions and use different rules for assigning conversion credit. A search or ad click also does not always become a recorded Analytics session: consent choices, browser privacy settings, ad blockers, and page-load interruptions can affect what each platform observes.
Why Google Search clicks and Analytics sessions can differ
A website received 1,000 clicks from Google Search according to Search Console. Google Analytics recorded 820 organic-search sessions. Both numbers can be valid.
Search Console counts clicks from Google Search results. Google Analytics records sessions after its measurement tag loads. A click may not become a recorded session when a visitor leaves before the page loads, declines analytics cookies, uses browser privacy tools, or blocks the analytics tag.
Use Search Console for Google Search clicks. Use Google Analytics for measured on-site behavior after the visit begins.
The report uses the source best suited to the question. Payment, booking, call-tracking, and CRM systems remain the best confirmation of completed business outcomes.
Metrics Used for Diagnosis
Some metrics help diagnose a change but do not belong in the report’s main summary. Headline metrics should explain leads, sales, organic demand, advertising efficiency, or a material measurement issue.
| Metric | Why it is not usually a headline | When it is useful |
|---|---|---|
| Search impressions | Shows Google Search visibility, not visits, leads, or revenue | Investigating changes in search demand, rankings, or result layout |
| Click-through rate | Can change with position, query mix, titles, and result layout | Diagnosing a defined page or query opportunity |
| Average position | An aggregate that can conceal page, device, and query differences | Investigating targeted ranking movement |
| Raw form events | May include incomplete attempts, duplicates, spam, or actions outside the lead definition | Conversion-tracking QA |
| Sessions | Shows recorded traffic volume, not a business outcome by itself | Explaining changes in lead volume, revenue, or channel activity |
| Engagement metrics | Shows interaction, not necessarily intent or commercial value | Reviewing content or landing-page behavior |
When one of these measures is necessary to explain a material result, it appears in a detailed report section with the relevant context.
Questions About Your Report
If a metric is unclear, reply to the report email. We can explain the source, calculation, and comparison used in that report. When your business priorities or tracking setup changes, we can update the report and document the change so later comparisons remain useful.